
Estimation of wheat area in Córdoba, Argentina, with multitemporal NDVI data of SPOT-Vegetation
| dc.contributor.author | De la Casa, Antonio Carlos | |
| dc.contributor.author | Ovando, Gustavo Gabriel | |
| dc.date.accessioned | 2022-05-12T14:18:55Z | |
| dc.date.available | 2022-05-12T14:18:55Z | |
| dc.date.issued | 2013 | |
| dc.identifier.citation | De la Casa, A. C. and Ovando, G. G. (2013). Estimation of wheat area in Córdoba, Argentina, with multitemporal NDVI data of SPOT-Vegetation. International Journal of Geosciences, 4(10), 1355-1364. http://dx.doi.org/10.4236/ijg.2013.410132 | |
| dc.identifier.uri | http://hdl.handle.net/11086/24825 | |
| dc.identifier.uri | http://dx.doi.org/10.4236/ijg.2013.410132 | |
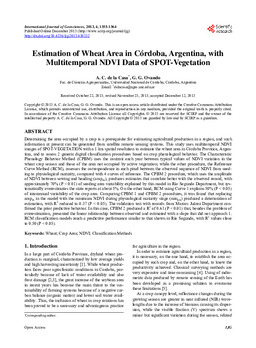
| dc.description.abstract | Determining the area occupied by a crop is a prerequisite for estimating agricultural production in a region, and such information at present can be generated from satellite remote sensing systems. This study uses multitemporal NDVI images of SPOT-VEGETATION with a 1 km spatial resolution to estimate the wheat area in Córdoba Province, Argentina, and to assess 2 generic digital classification procedures based on crop phenological behavior. The Characteristic Phenology Behavior Method (CPBM) uses the contrast each year between typical values of NDVI variation in the wheat crop season and those of the area not occupied by active vegetation; while the other procedure, the Reference Curve Method (RCM), assesses the correspondence in each pixel between the observed sequence of NDVI from seed- ing to physiological maturity, compared with 4 curves of reference. The CPBM 2 procedure, which uses the amplitude of NDVI between sowing and heading (ampsh), produces estimates that correlate better with the observed record, with approximately 70% (P < 0.01) of seeding area variability explained by this model in Río Segundo Department, but sys- tematically overestimates the state reports at about 5%. On the other hand, RCM using Curve 1 explains 50% (P < 0.05) of interannual variability of the crop area. Comparing CPBM 1 and CPBM 2 procedures, it was found that replacing ampsh in the model with the minimum NDVI during physiological maturity stage (minpm) produced a deterioration of estimation, with R² reduced to 0.37 (P < 0.05). The validation test with records from Marcos Juárez Department con- firmed the prior predictive behavior. In this case, CPBM 2 produced a R² of 0.61 (P < 0.01) that, besides the problem of overestimation, presented the linear relationship between observed and estimated with a slope that did not approach 1. RCM classification models reach a predictive performance similar to that shown in Río Segundo, with R² values close to 0.50 (P < 0.05). | en |
| dc.language.iso | eng | en |
| dc.rights | Atribución 4.0 Internacional | * |
| dc.rights.uri | http://creativecommons.org/licenses/by/4.0/ | * |
| dc.source | International Journal of Geosciences, 2013: 4 (10), 1355-1364 | |
| dc.source | ISSN: 2156-8367 | |
| dc.source.uri | https://www.scirp.org/journal/journalarticles.aspx?journalid=209 | |
| dc.subject | Trigo | es |
| dc.subject | Teledetección | es |
| dc.subject | Imágenes por satélites | es |
| dc.subject | Análisis de imágenes | es |
| dc.subject | Modelos | es |
| dc.title | Estimation of wheat area in Córdoba, Argentina, with multitemporal NDVI data of SPOT-Vegetation | es |
| dc.type | article | es |
| dc.description.version | publishedVersion | es |
| dc.description.fil | Fil: De la Casa, Antonio Carlos. Universidad Nacional de Córdoba. Facultad de Ciencias Agropecuarias; Argentina. | es |
| dc.description.fil | Fil: Ovando, Gustavo Gabriel. Universidad Nacional de Córdoba. Facultad de Ciencias Agropecuarias; Argentina. | es |
Files in this item
This item appears in the following Collection(s)
-
FCA - Artículos 2013
Memoria Sigeva 2013

Except where otherwise noted, this item's license is described as Atribución 4.0 Internacional